Housing Solutions
--
Housing Solutions --
Fall 2025 Studio || Vy Ting Lam & Megan Peters
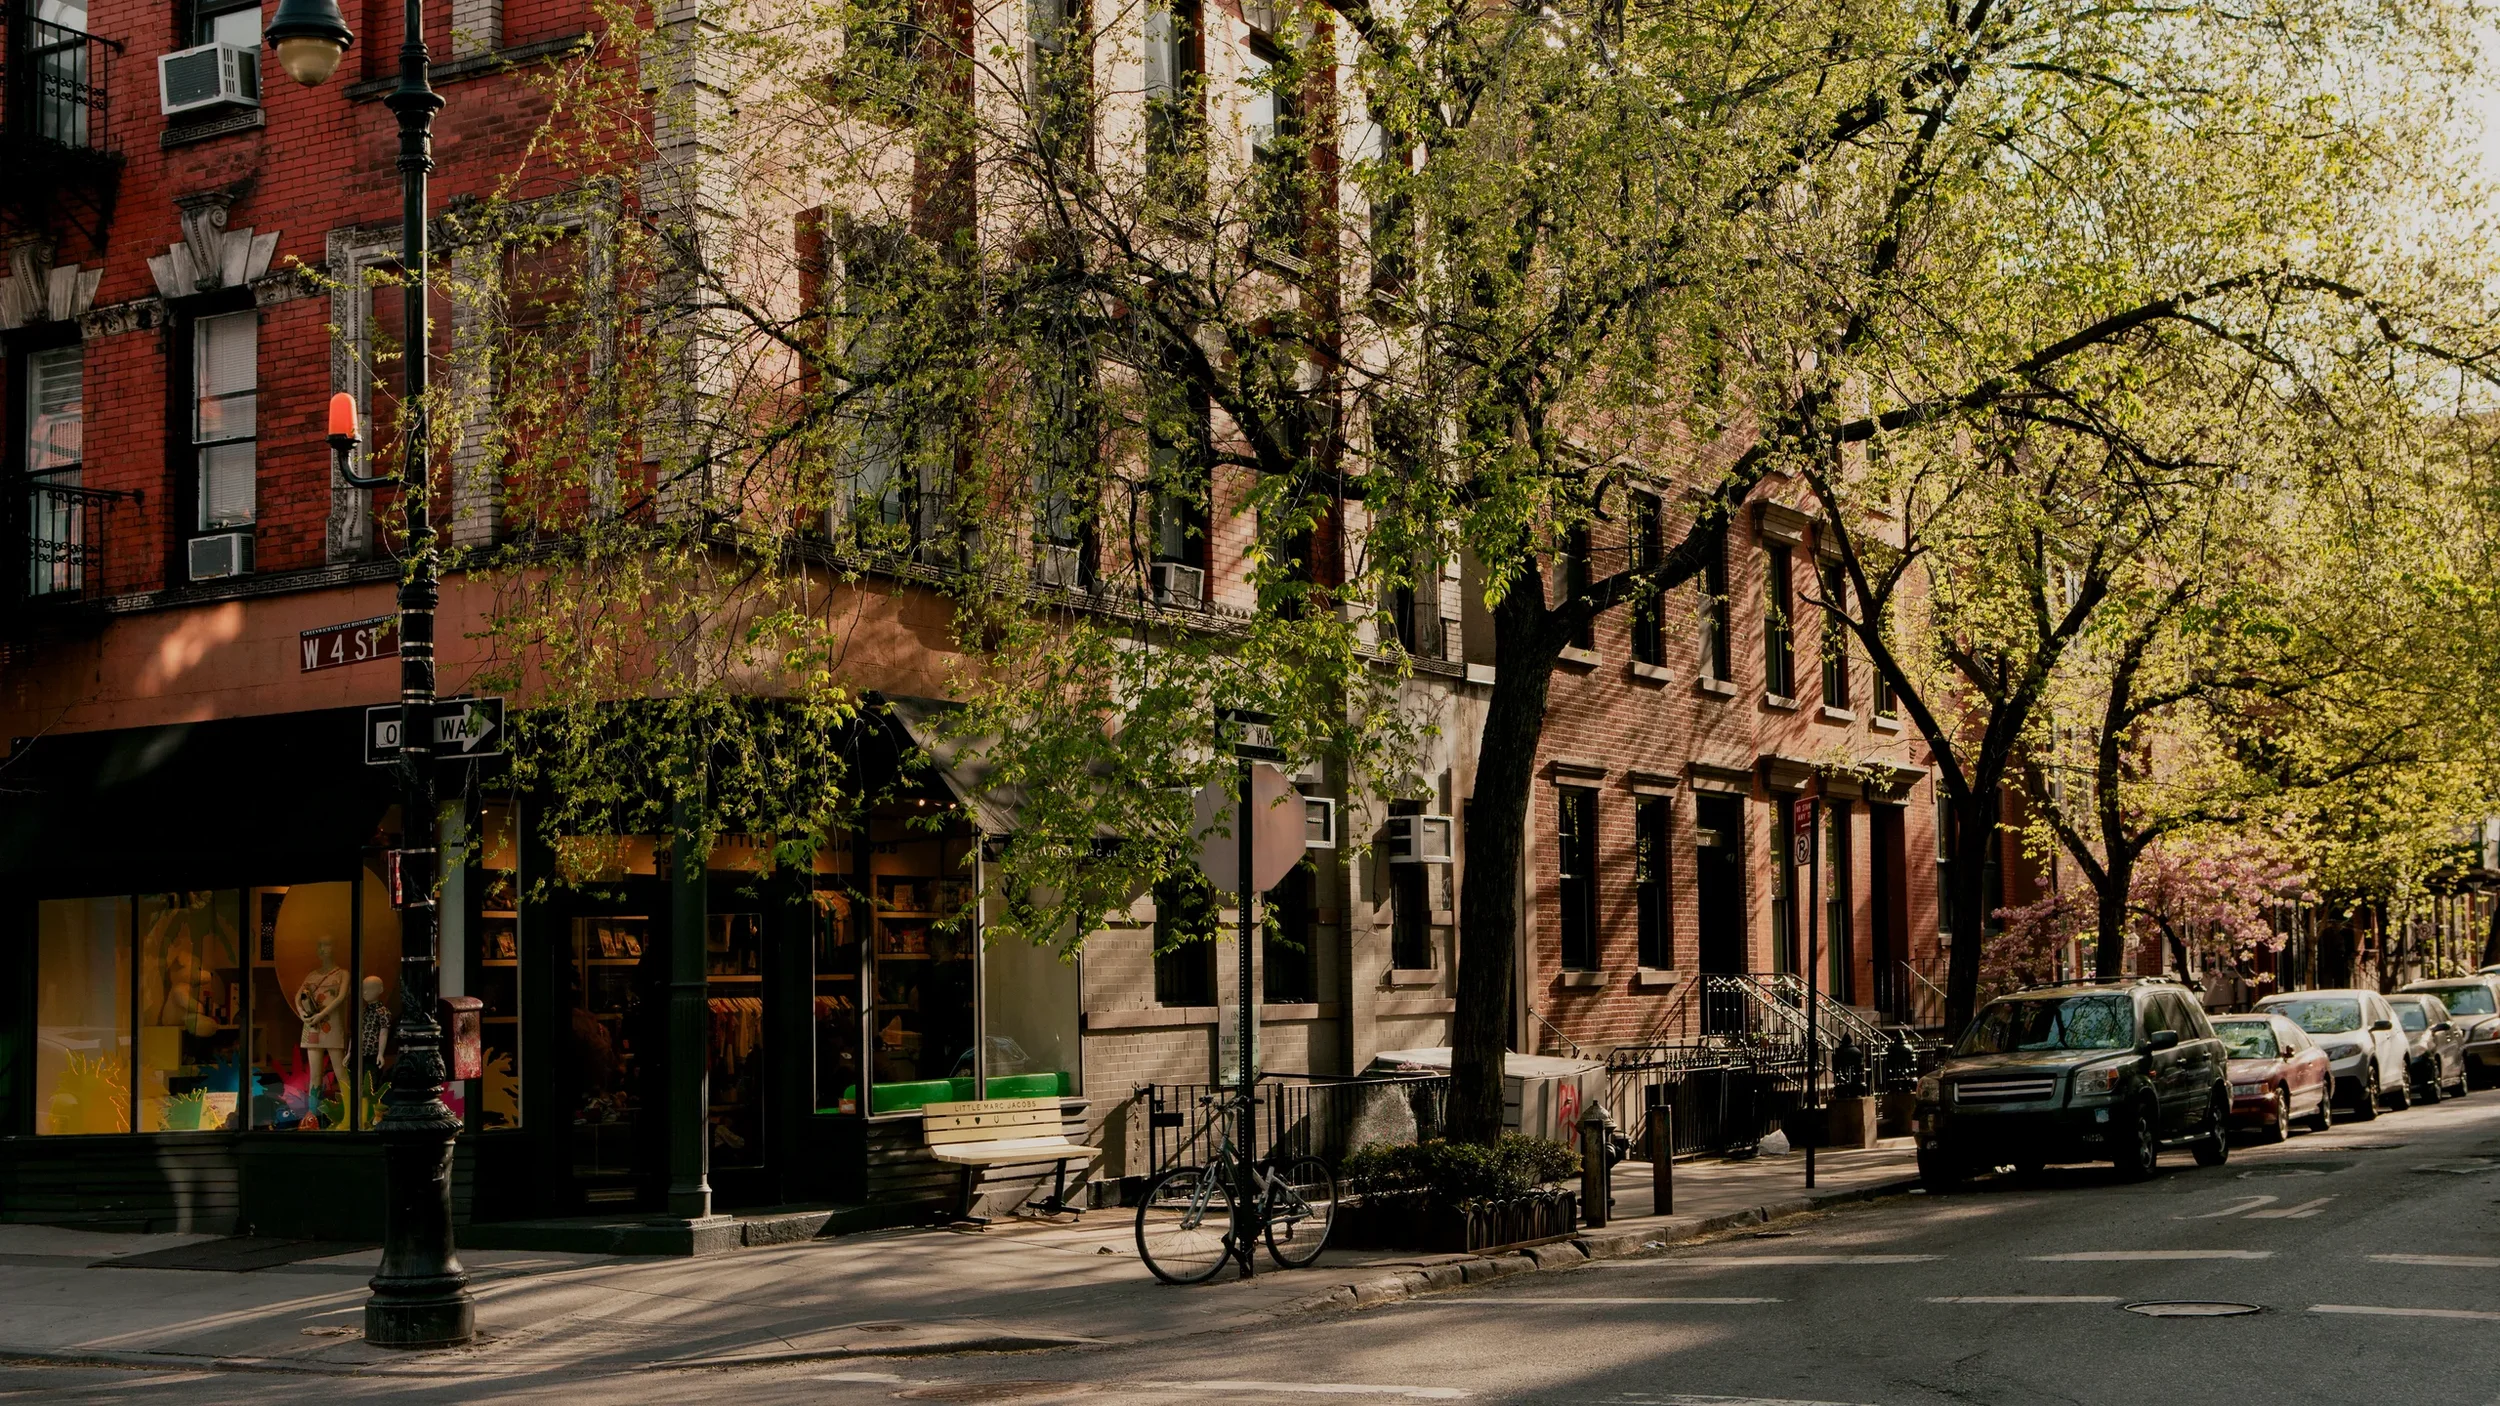
EXPANDING THE WEST VILLAGE
Contextualizing the Site
Diving Deeper: A Background of West and Greenwich Village's Culture and Preservation
-
Before large waves of immigration, the West Village already stood apart from the rest of Manhattan with its irregular streets, intimate scale, and early artistic atmosphere. By the mid 1800s, it was developing into a creative center, marked by the Tenth Street Studios in 1857, the first modern building designed specifically for artists to work and live in. As German, Irish, Italian, and later Eastern European immigrants settled in the area, they brought new trades, traditions, and cultural layers. Affordable rents and an open minded spirit made the Village a haven for writers, performers, and social reformers, building an early creative energy that still defines its character. Together, these influences shaped the West Village into one of New York’s most diverse and expressive neighborhoods.
-
At the turn of the 20th century, the West Village had become a charming, ethnically diverse neighborhood that nurtured freedom of expression. By World War I, it was celebrated as a bohemian district, known for its low rents and tolerance for radical ideas. Artists, writers, and thinkers thrived here, publishing avant-garde magazines, opening small galleries, and forming experimental theater companies that rejected Broadway’s commercialism. The Village’s eccentricity soon drew tourists to its speakeasies, art studios, and costume balls. During this golden age of creativity, old row houses were converted into flats, and by 1926, luxury apartments rose near Washington Square, just before the 1929 market crash brought this era to a pause.
-
During the mid twentieth century, the West Village became a central stage for major urban renewal conflicts, most famously the debates between Jane Jacobs and Robert Moses. Residents organized strong civic resistance as plans for demolition, high rise housing, and large urban developments threatened the neighborhood’s scale and community life. These proposals risked displacement, rising rents, and growing income segregation. In response, local advocates formed the Committee to save the West Village, which fought to protect low and middle income housing and prevent residents from being pushed out. Their efforts established one of the earliest lawful historic preservation standards for any neighborhood in the country, setting a precedent for community led planning and ensuring that decisions reflected the needs of the Village rather than the priorities of developers.
Zooming into Townhouses
Our Vertical Extension Proposal
Expansion into the Neighborhood
Behind the Scenes
Developing the Site Context dashboard
By linking the BBL (Borough, Block, Lot) numbers from the QGIS PLUTO map of NYC to this Google Sheet that we created, we were able to populate our interactive West Village map with details of the specific business/es that were at each specific building. This shows up in the bubbles when buildings are selected in the tool, providing more context into what a vertical extension project would need to consider.


The QGIS PLUTO map of NYC that has only the lots in view, with a gradient overlaid, demonstrating which has the most FAR (the darker colors) and the least FAR (the lighter colors).

The QGIS PLUTO map of NYC that has the buildings overlaid onto the lots.
Developing the Proposal Dashboard
To obtain the values for the carbon impact of the building materials, we ran an EcoAudit simulation and transferred these values to separate Google Sheet documents according to which extension type it was for. These documents were then linked into the Observable tool, with the correct values called, dependent on the material and extension type selected.
By doing this, users can actively see how much carbon is released into the atmosphere with our chosen building materials per component of the construction process, and compare these values to other normative materials.


