To Deal Water Shortage In Los Angeles
Water is an important resource on the planet, however, it is been limited because the population has increased every year and the realities of climate change in Los Angeles. Also, because flood and earthquake risks and human has developed the lands used, it requires a new way to water management in the areas, and how the region's transition can to a sustainable future be a goal here.

About Los Angeles
Coordinates: 34°03’N 118°15’W
Los Angeles is the largest city in California and is the 2nd-largest city in the United States.
Sprawling metropolitan area.
The most populous county in the United States.
Diversity in ethnic and cultural.
Landmark: Hollywood as a symbol of the American film industry.
History
Founded: September 4 1781 under Spanish governor Felipe de Neve in the village of Yaanga.
1821: It is a part of Mexico that followed the Mexican War of Independence.
1848: It became part of the United States because Los Angeles and the rest of California were purchased as part of the Treaty of Guadalupe Hidalgo by the end of the Mexican-American War.
It will host the 2028 Summer Olympics.
Transportation:
MSA: The Los Angeles metropolitan area is home to a population of 13.1 million, making it the 2nd largest metropolitan area in the nation after New York.
2018: The MSA had a gross metropolitan product of over $1 trillion, which makes the city with 3rd largest GDP in the world, after Tokyo and New York City.
Geology & Cityscape
GEOLOGY
Earthquakes: 100/yr
The seismologists have warned the next big earthquake will happen recently because a major earthquake roughly every 110 to 140 years and the last major one happened in 1857, the Fort Tejon earthquake.
CITYSCAPE
Grid plan in urban design
Low-rise buildings
Climate and Environmental Data
Mediterranean climate: Hot & Dry In The Summer; Cool in The Winter.
Also subject to phenomena typical of a microclimate. It means the average temperature was 100F in Los Angeles, but 20 miles away from the beach is 80F.
June Gloom:
The weather has foggy skies in the early morning, then it turns to the sun in the afternoon.
Mudslides
Flood Risk
Wildfires
Rainy days bring floods to the lowland and mudslides to the hills, especially after wildfires have denuded the slopes.
Annual Population In Los Angeles
According to the urban sprawling, the population grows every year.
Annual Precipitation In Los Angeles
Precipitation Location
Altitude:
Elevation: 305 ft
Highest Elevation: 5,074 ft
Lowest Elevation: 0 ft
This map of contour line represents the spatial distribution of the 85th and 95th percentile, 24-hour rainfall within the County of Los Angeles.
Rainfall gages throughout the County were selected based on spatial distribution and rainfall record length to determine the 85th and 95th percentile, 24-hour rainfall. The 85th and 95th percentile, 24-hour rainfall can be used to determine the stormwater quality design volume per Public Works Low Impact Design Manual.
Water Resource Location
This map of points or areas represents the water resource locations with a name.
Physical water features extracted from the USGS Geographic Names Information Systems.
This dataset is maintained through the County of Los Angeles Location Management System. The Location Management System is used by the County of Los Angeles GIS Program to maintain a single, comprehensive geographic database of locations countywide.
Water
Water covered 70% of the earth’s surface. However, the freshwater is less than 1%, and only 1% of that 1% is accessible for human use.
Decreasing Water Supply Due To Los Angeles Population Growth More Than Other County In California.
California Population
California Water Use per Day per Person
Current Population:
California: 39.51 million
LA County: 10.04 million
LA City: 3.967 million
Can Los Angeles Grow With Climate Change Ensuring Less Water
Current Water Consumption and Recent Trends
LA county
Usage 2020: 81 gal/day/person (Emergency order canceled for drought conditions)
Usage 2017: 59.3 gal/day/person (End of major drought)
Usage 2016: 85.0 gal/day/person
Usage 2013: 139 gal/per/day (Start of major drought)
During the drought period, water use per capita decreased in Southern California because of enforcement programs after the Governor's mandatory drought restrictions. But the use was rising again after Governor canceled mandatory drought restrictions, and many water utilities pulled back on aggressive water conservation messaging.
Where Los Angeles Get Water
Los Angeles Imported Water Sources of Map
size:
Prefecture: 501.55 square miles
City: 469 sq mi
Water: 32.06 sq mi
Density: 8,304.22/ sq mi
Where Los Angeles Get Water
Imported Water: 49% *(0.7 million Acre-feet)
Los Angeles's imported water comes from the Sierra Nevadas, the Owens Valley, the Colorado River, and Northern California, where is primarily collected as runoff and snowmelt.
Local Ground Water: 35% *(0.5 million Acre-feet)
Recycled Water: 10%* (0.2 million Acre-feet)
LA Aqueduct : 6% *(0.1 million Acre-feet)
*The Data is from Los Angeles County Water Sources in 2016.

Los Angeles Couty’s Water Sources, Amounts, and Uses

LA County Lakes, Streams, And Rivers Replenish Groundwater Basins.
Other Regional Water

Colorado River levels during the current drought, 1.4 trillion gallons lower than normal.
LA County Groundwater Basins
Current Water Management
Reduce Use
Current county goal is to lower residential use to < 55 gal/day/person.
Colorado River uses is regulated by the federal government when levels are too low to support all states using water sources.
Allowed watering days for yards and plants.
Incentive program for homeowners to remove grass and shift plants to succulent varieties.
Wastewater Treatment and Recycling
The large treatment plants in Los Angeles are owned either by the Los Angeles County Sanitation Districts or the City of Los Angeles. All of the large treatment plants treat and discharge around 247 billion gallons a year to the ocean and local waterways like the Los Angeles and San Gabriel Rivers. Many plants also produce recycled water that is being used in place of potable water for non-consumptive uses such as industrial, landscape, and recreational purposes, as well as for indirect potable reuse through groundwater recharge. Wastewater recycling offers an additional source of local water for the region and the current production can be significantly expanded.
Target
According to The City of Los Angeles and Mayor Eric Garcetti have plans to reduce LA’s carbon footprint, scale-up water, and energy efficiencies, grow the economy, and protect the environment. It is called the Green New Deal Sustainable City pLAn.
All these water goals have a 2035 deadline:
Source 70% of L.A.'s water locally and capture 150,000-acre ft/yr (AFY) of stormwater.
Recycle 100% of all wastewater for beneficial reuse.
Build at least 10 new multi-benefit stormwater capture projects by 2025; 100 by 2035; and 200 by 2050.
Reduce potable water use per capita by 22.5% by 2025; 25% by 2035; and maintain or reduce 2035 per capita water use through 2050
Install or refurbish hydration stations at 200 sites, prioritizing municipally-owned buildings and public properties such as parks, by 2035
Design Planning
Los Angeles Can Grow With Climate Change Ensuring Usage Less Water, But It Still Needs To Find The Way To Have The Next Step.
Current Water Consumption and Recent Trends
LA county
Usage 2020: 81 gal/day/person (Emergency order canceled for drought conditions)
Usage 2017: 59.3 gal/day/person (End of major drought)
Usage 2016: 85.0 gal/day/person
Usage 2013: 139 gal/per/day (Start of major drought)
During the drought period, water use per capita decreased in Southern California because of enforcement programs after the Governor's mandatory drought restrictions. But the use was rising again after Governor canceled mandatory drought restrictions, and many water utilities pulled back on aggressive water conservation messaging.
According to the water efficiency and target of the city of Los Angeles, designing recycled water in the building is this proposed most important concept.


Current Water Life Cycle
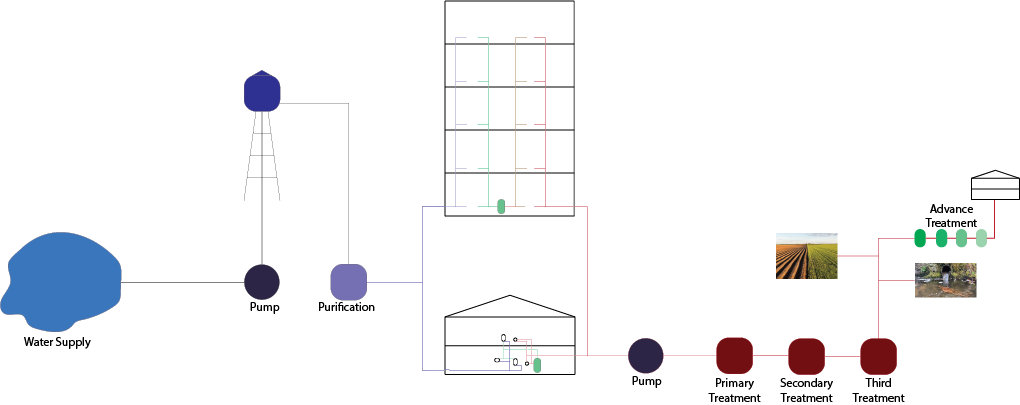
Current Water Life Cycle with On-site Purification
REFERENCE:
Los Angeles Open Data
https://egis-lacounty.hub.arcgis.com/
County of Los Angeles_Enterprise Geographic Information Systems
https://data.lacity.org/
KPCC
https://www.kpcc.org/
OurCounty
https://ourcountyla.lacounty.gov/
California Department of Water Resources
https://water.ca.gov/
American Rivers
https://www.americanrivers.org/
Green New Deal pLAn
https://plan.lamayor.org/